 English
 简体中文
简体中文
 Deutsch

 Joyeeta Bhattacharya, PhD
Sr. Product Application Scientist
Picarro Spotlight is a blog series showcasing important scientific work from our customers around the world. Each blog is selected and summarized by our team. Enjoy!
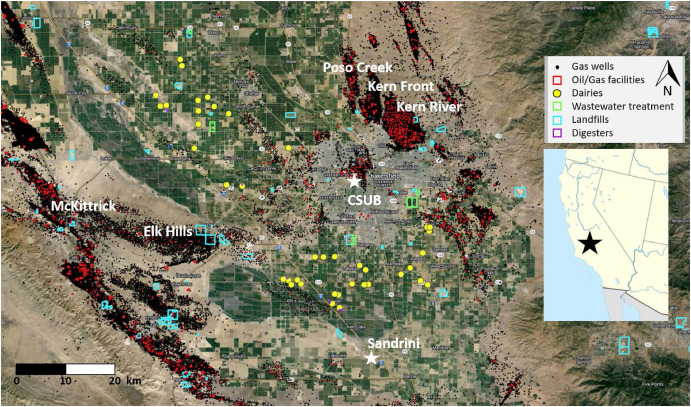
In regions like California's southern San Joaquin Valley, methane can originate from oil and gas operations, dairies, landfills, wastewater treatment plants, or natural gas infrastructure. Traditional methane measurements reveal that emissions are present, but not necessarily their source origin. Without that information, mitigation efforts become slower, more expensive, and less effective.
A study by Sebastien Biraud, Andrew B. Moyes, and team at Lawrence Berkeley National Laboratory (LBNL) demonstrates how combining two chemical fingerprints can solve this challenge. By measuring both the ethane-to-methane ratio (C₂:C₁) and methane's stable carbon isotope signature (δ¹³CH₄), researchers were able to distinguish multiple methane sources with remarkable confidence. Picarro's G2210-i Carbon Isotope CH₄ and C₂H₆ Analyzer provided the high-precision measurements that made this work possible.
"Our results demonstrate considerable utility of diagnostic ethane and δ¹³CH4 measurements in partitioning several methane source types."
— Moyes et al., 2025
Turning Measurements into Source Attribution
As part of the California Energy Commission's SUMMATION project, researchers combined five mobile survey campaigns with continuous atmospheric measurements from two monitoring towers across the southern San Joaquin Valley. In work spanning nearly two years, the team investigated 108 methane enhancement events originating from 74 unique sources, including oil and gas facilities, natural gas pipelines, dairies, and wastewater treatment plants.
The power of the approach lies in combining two complementary measurements.
Biogenic methane sources, such as dairies and wastewater treatment plants, produce virtually no ethane, while thermogenic methane from fossil fuel systems is mixed with a measurable amount of ethane. Stable carbon isotope measurements add a second identifying characteristic, allowing researchers to distinguish methane produced through microbial activity from methane generated deep underground.
Together, these two tracers create a distinctive chemical fingerprint for many methane sources, making attribution significantly more reliable than using methane concentration alone.
Every Methane Source Leaves a Different Fingerprint
The dual-tracer method clearly separated emissions from dairies, wastewater treatment facilities, urban natural gas systems, and many oil and gas production sites.
Dairies exhibited the isotopic signatures expected from microbial fermentation, while urban natural gas leaks formed a remarkably consistent fingerprint that made them among the easiest sources to identify. Oil and gas production sites displayed greater variability, reflecting differences in geology and hydrocarbon maturity across California's producing fields, yet the combination of isotope and ethane measurements still provided valuable discrimination between source types.
Rather than relying on assumptions about nearby infrastructure, researchers could determine the most likely source based on direct atmospheric measurements.
From Detection to Action
Perhaps the most compelling finding was how quickly these measurements translated into real-world outcomes.
When mobile surveys detected methane signatures consistent with natural gas infrastructure, researchers reported the locations to the local utility. In every case, pipeline leaks were confirmed and repaired.
In another example, a persistent methane plume in a residential neighborhood initially appeared to originate from the surrounding gas distribution network. However, its isotopic fingerprint told a different story. The measurements instead pointed toward a nearby oil field. A subsequent search of California's Well Finder database revealed an abandoned oil well beneath one of the properties—plugged nearly two decades earlier—as the likely source.
These examples demonstrate how source attribution can accelerate investigations while preventing unnecessary inspections of the wrong infrastructure.
Connecting Local Emissions to Regional Monitoring
The study also demonstrated that source fingerprints remain visible at much larger scales.
Continuous measurements from two atmospheric monitoring towers confirmed the same source patterns observed during mobile surveys. The urban monitoring site captured frequent contributions from both fossil fuel and biogenic sources, reflecting its proximity to oil fields and dairies. Meanwhile, the rural tower recorded predominantly biogenic emissions consistent with the surrounding agricultural landscape.
At the center of both measurement campaigns was the Picarro G2210-i. Installed in survey vehicles, the analyzer provided simultaneous measurements of concentrations of methane and ethane, as well as methane carbon isotope ratio, utilized for mobile plume mapping. At the fixed monitoring towers, the same instrument continuously collected the calibrated isotopic data required for long-term atmospheric analysis.
Independent validation against a second analytical platform showed excellent agreement, demonstrating the robustness of the measurement approach across both mobile and stationary monitoring applications.
Looking Ahead
The LBNL team is now extending this work by combining dual-tracer measurements with atmospheric transport and dispersion models to estimate methane emission rates and better quantify regional emission sources.
More broadly, the study highlights an important shift in methane monitoring. Detecting emissions is only the first step. To reduce emissions efficiently, operators and regulators must know exactly where methane is coming from.
By combining high-precision isotopic measurements with ethane analysis, researchers demonstrated a practical pathway from methane detection to confident source attribution—providing the actionable intelligence needed to identify the right source, prioritize investigations, and take meaningful corrective action.
For More Information
- Read the Research: Dense and Diverse Regional Methane Sources Characterized Using a Tiered, Dual-Tracer Measurement Strategy, Moyes, et al., Atmospheric Environment, 2025
- Explore the Picarro Research Center
- Learn more about the G2210-i Carbon Isotope CH₄ and C₂H₆ Analyzer